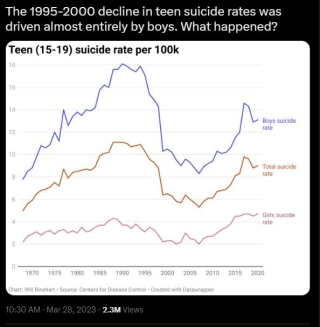
Bad Graph Interpretation of the Day: Well, if I had to guess, I would say bad math happened.
Saw this tweet this morning with 2.3M views:
Just eyeballing it, from 1995-2000, boy suicide rates fell from about 11 to about 6 per 100K, a 45% decline. Girl suicide rates fell from about 4 to about 2 per 100K, a 50% decline. Correspondingly, the overall suicide rates fell from around 18 to around 9, again a 50% drop.
I’m not seeing the claimed gender difference in the fall in rates.
I think the more relevant question is why the strong rebound from 2007 or so on?
I’m going to posit that the rise in social media might play a role.
0


